

Under normal market conditions, the S&P 500 and the CBOE Volatility Index (VIX) share a highly predictable, inverse relationship. When the stock market marches upward, equity investors grow confident, complacency sets in, and the VIX—often dubbed the market’s “fear gauge”—drifts downward. A rising market usually signals clear skies ahead.
Every so often, however, the financial machinery breaks away from standard correlations to produce a rare statistical anomaly known as a “Melt-Up with Fear.”
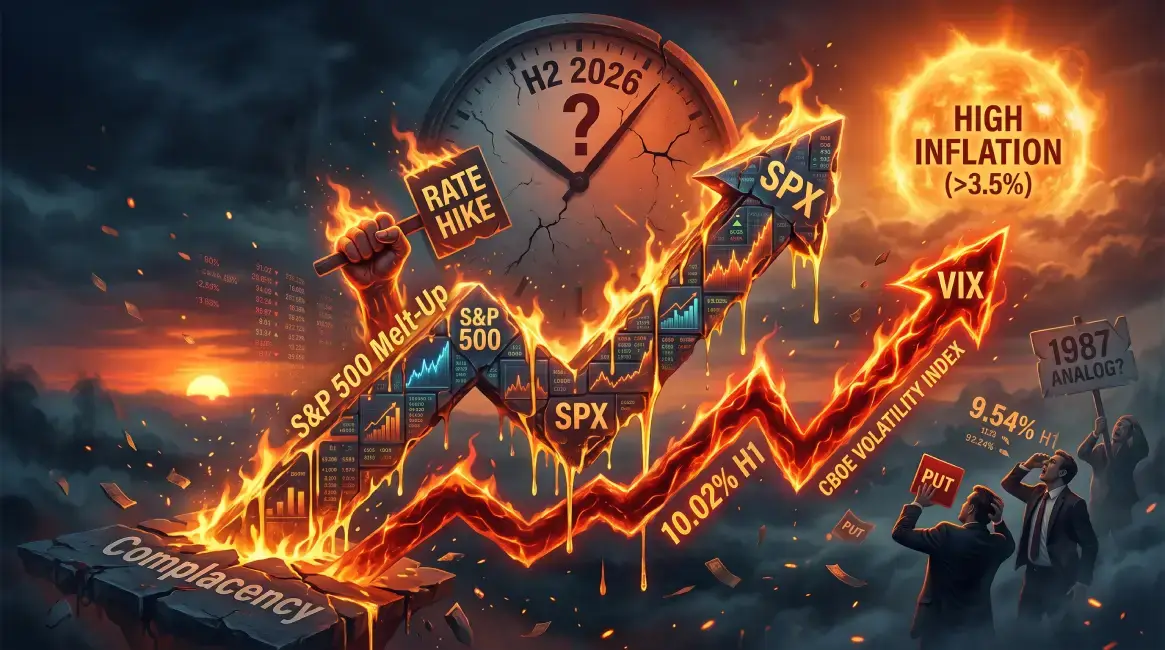
Through the first six months of 2026, the market has carved out exactly this type of baffling divergence. Through June 2026, the S&P 500 managed a robust return of 9.54%. Yet, instead of cratering into deep complacency, the VIX actually outperformed the broader index, posting a return of 10.02%.
When the VIX rises alongside a rallying stock market, it acts as a corporate smoke alarm sounding right before a fire breaks out. History shows that when this specific phenomenon occurs in the first half of the year (H1), dropping a central bank interest rate hike into the mix during the second half (H2) tends to trigger severe market turbulence.
To understand what lies ahead for the rest of 2026, we must evaluate the psychological forces driving this anomaly and examine the historical precedents that established our current market playbook.
Decoding the H1 “Smoke Alarm”
The unusual divergence seen in the opening half of 2026 provides a direct window into institutional investor psychology. When the VIX climbs alongside a positive index return, it reveals a profound internal conflict on Wall Street: institutional managers are highly unwilling to miss out on a 9.54% market rally, but they are simultaneously terrified of an impending macroeconomic catalyst.
To maintain their long positions and defend their quarterly performance, these large institutions aggressively purchase put options to insure their multi-billion-dollar portfolios. This massive, concentrated demand for downside protection drives up implied volatility, artificially lifting the VIX.
By outperforming the stock market’s gains, the options market loudly broadcasts that sophisticated capital expects a major shock in H2. If that expected shock happens to materialize as an interest rate hike, history suggests that the market’s underlying fear is completely justified.
The Low-Inflation Precedents: 1999 and 2018
Because the VIX was only introduced in 1993, researchers have a relatively compact 33-year dataset to analyze. When we isolate historical periods featuring a strong H1 market, rising H1 volatility, and subsequent H2 interest rate hikes, two primary low-inflation years stand out: 1999 and 2018.
The 1999 Scenario: The Volatile Melt-Up
During the height of the dot-com boom in 1999, the stock market was surging forward on immense momentum. However, the VIX steadily climbed right alongside it because savvy investors recognized that corporate valuations were becoming dangerously stretched. Seeking to cool off an overheating economy, the Federal Reserve intervened by executing three consecutive interest rate hikes in the second half of the year: June, August, and November.
The H2 Consequence: The S&P 500 suffered a violent 10% correction between July and October as it struggled to digest the rising cost of capital. While the market’s raw momentum ultimately fueled a Q4 recovery—allowing H2 to finish up roughly 7%—the severe structural strain directly laid the groundwork for the devastating tech crash of 2000.
The 2018 Scenario: The Fourth-Quarter Fracture
In 2018, equities displayed notable strength across the first three quarters of the year. Underneath the surface, however, underlying volatility began decoupling from price and rising as the Federal Reserve forged ahead with an aggressive tightening cycle.
The H2 Consequence: When the lagging structural impact of the final H2 rate hikes struck in September and December, the market’s fragile foundation gave way. The S&P 500 suffered a massive -19.8% drawdown in the fourth quarter alone, completely erasing prior progress and sending the second half of the year deeply into the red.
The Low-Inflation Verdict
Statistically, the combination of a rising H1 VIX and an H2 rate hike heavily suppresses second-half performance. In these historical environments, average H2 returns are compressed to a tight, highly choppy band of -5% to +2%. A sudden 5% to 10% drawdown during the late summer or early fall (historically concentrated in August and September) becomes almost guaranteed as rate hikes instantly compress valuation multiples. Furthermore, because higher interest rates make risk-free cash and bonds far more attractive, a firm cap is placed on equity upside, preventing the index from repeating its strong H1 performance.
The High-Inflation Paradigm (>3.5%) and the 1987 Analog
While 1999 and 2018 provide a highly useful base case, they lack one critical macroeconomic variable that heavily pressures modern markets: high inflation. During both 1999 and 2018, inflation remained at a tame, predictable baseline of 2.0% to 2.4%.
When you introduce the constraint of headline inflation running at 3.5% or higher to this specific scenario, the modern dataset completely shrinks. To find a historical environment that perfectly matches a “Melt-Up with Fear,” hot inflation (>3.5%), and an impending H2 interest rate hike, we must look to pre-VIX history by utilizing the VXO index—the VIX’s historical predecessor.
When we do, we arrive at the most infamous market analog in modern history: 1987.
1987: The Perfect Storm
In 1987, the financial markets mixed a highly toxic economic cocktail that mirrors the theoretical risks facing late 2026:
The H1 Setup: The S&P 500 experienced a spectacular melt-up, soaring roughly 25% by mid-year. Yet, underneath the surface, options volatility (the VXO) was steadily climbing from a reading of 15 to nearly 20. Institutional money was actively chasing the upside while aggressively purchasing insurance against an anticipated crash.
The Inflation Trigger: By the summer months, CPI inflation spiked sharply, climbing from 1.5% to cross the critical 3.7% threshold.
The H2 Catalyst: Faced with surging inflation, newly appointed Fed Chair Alan Greenspan took decisive action, raising the discount rate from 5.5% to 6.0% in early September.
The Catastrophic Result: The market’s underlying structure fractured entirely. The introduction of a rising cost of capital into a highly leveraged, overvalued, and anxious market environment led directly to “Black Monday” in October. The S&P 500 crashed by more than 20% in a single trading session, completely wiping out all H1 gains and concluding the second half of the year in a devastating drawdown.
Why Other High-Inflation Years Fail to Match
It is important to note that recent high-inflation periods do not fit this specific structural template. While the early 2020s experienced severe inflationary pressures, they lacked the distinct “Melt-Up with Fear” dynamic:
2022: Inflation was hot and the Fed hiked rates aggressively, but the S&P 500 was already down 20% in the first half of the year, leaving no H1 equity melt-up to defend.
2023: The S&P 500 staged a strong H1 rally, but the VIX collapsed from 22 down to 13, proving that defensive institutional hedging was entirely absent.
The Verdict: A Guide for the Remainder of 2026
The core takeaway from historical data is clear: when headline inflation persists above the 3.5% mark, the Federal Reserve’s policy options are severely restricted. Central bankers are forced to raise interest rates—or hold them painfully high—to actively destroy economic demand, even if doing so runs the explicit risk of breaking the financial markets.
With the S&P 500 up 9.54% and the VIX outperforming it at 10.02% through June, the options market is flashing a massive red warning sign for the second half of 2026. It indicates that if an H2 interest rate hike materializes in a sticky inflation environment, it could easily serve as the final straw that breaks the camel’s back. Rather than a gentle slowdown, this combination is a historical precursor to a rapid, violent de-risking event reminiscent of late 1987.
The H2 Trading Playbook
To navigate this delicate macro environment, seasoned investors generally avoid fighting the options market’s warning signals. If history serves as an accurate guide for the rest of 2026, market participants should anticipate heightened choppiness and prepare for a significant Q3 correction.
In order to preserve capital against an impending interest rate shock, the standard institutional playbook dictates a defensive transition. This involves rotating capital out of high-multiple growth stocks—which are uniquely vulnerable to rising interest rates—and reallocating those funds into defensive sectors or cash equivalents to successfully weather the anticipated H2 volatility.

Leave a Comment
You must be logged in to post a comment.