

The advance/decline line (A/D line) is a technical indicator that shows how many stocks are participating in a market rally or decline. It’s calculated by taking the difference between the number of advancing and declining issues and adding the result to the previous value. All in all, it rises when advances exceed declines and falls when declines exceed advances.
Recently, there’s been some worry among market participants over the declining Nasdaq Composite Index (Nasdaq Composite) A/D line. At the start of the year the Nasdaq Composite A/D line starting to diverge from the overall performance of the index. That is to say that the majority of stocks in the Nasdaq Composite are declining, although the overall Nasdaq Composite is advancing. See below:

However, the other 3 main indexes (S&P 500, Dow Jones, Nasdaq 100) are all showing advancing A/D lines to support the rising in the indexes themselves. This could confirm that the overall market rally in 2024 is broad based as the majority of stocks in those indexes are advancing as well. See below:
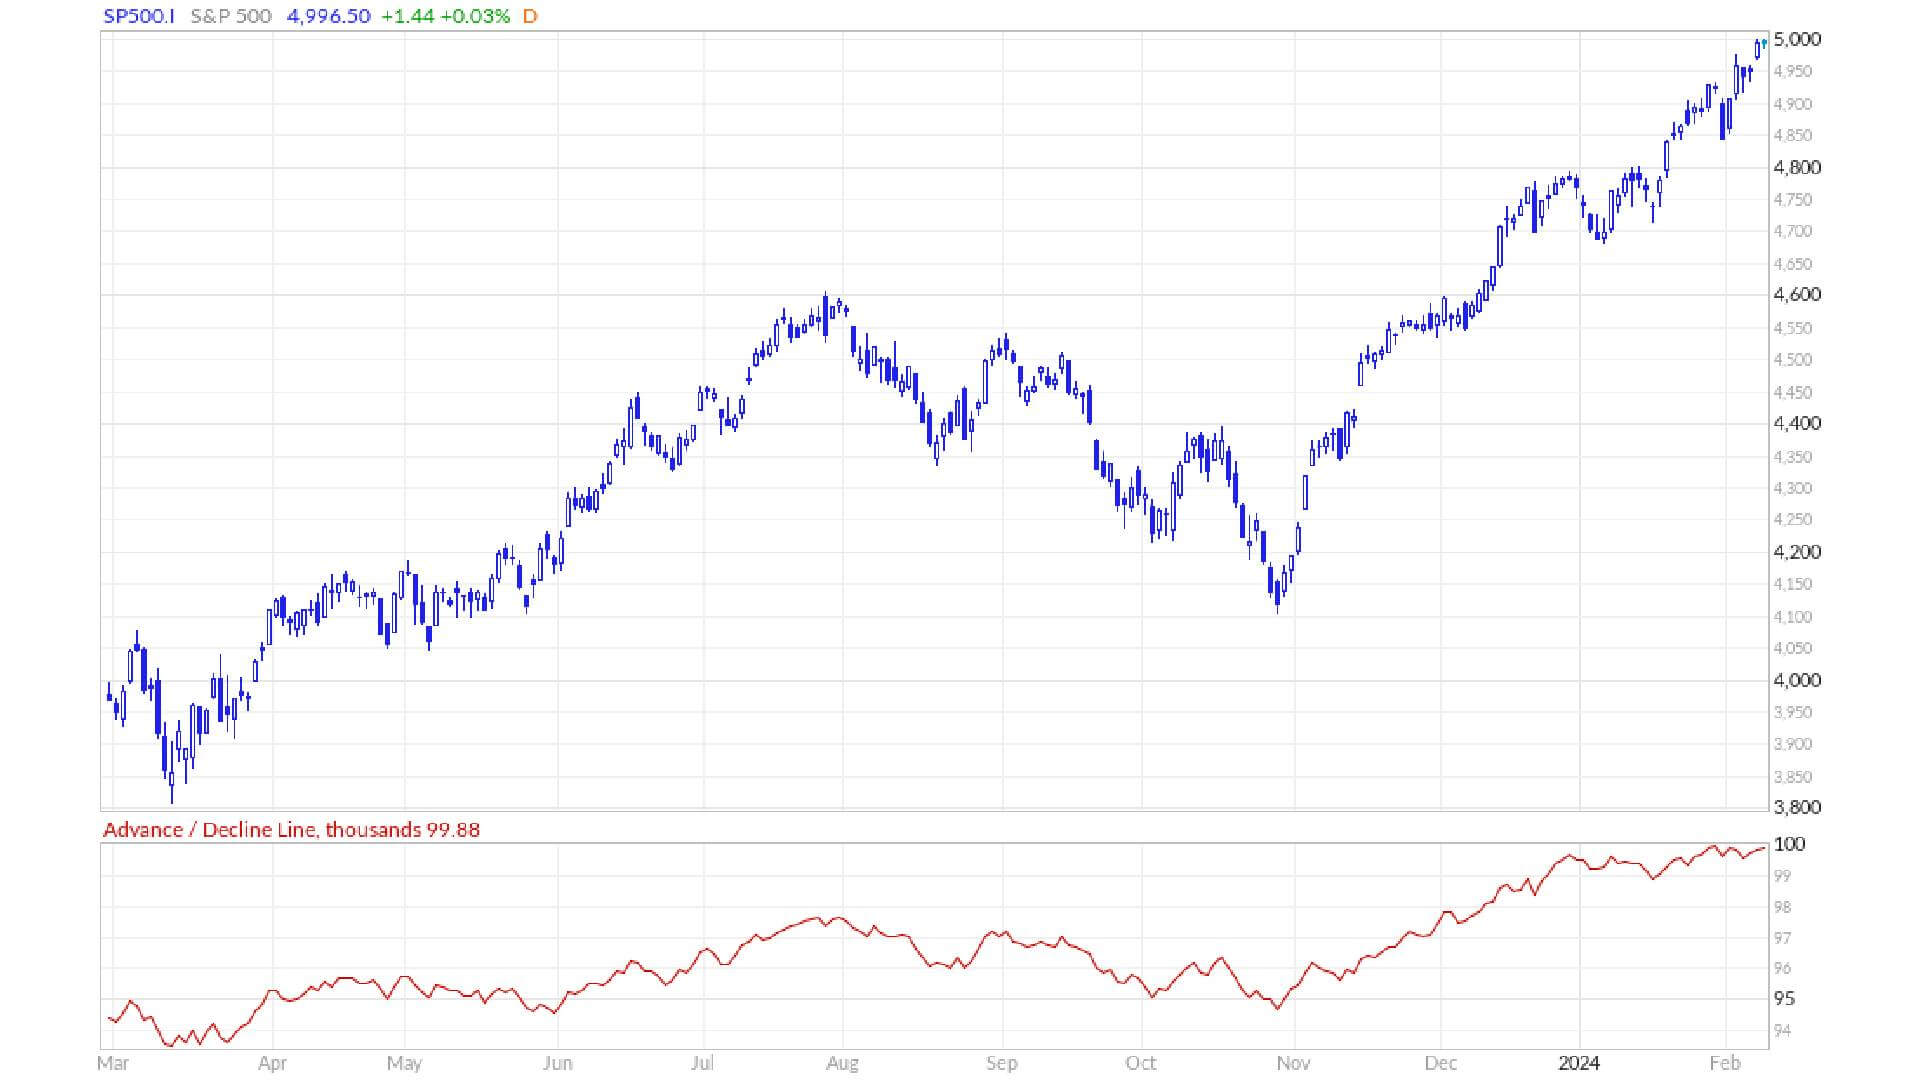
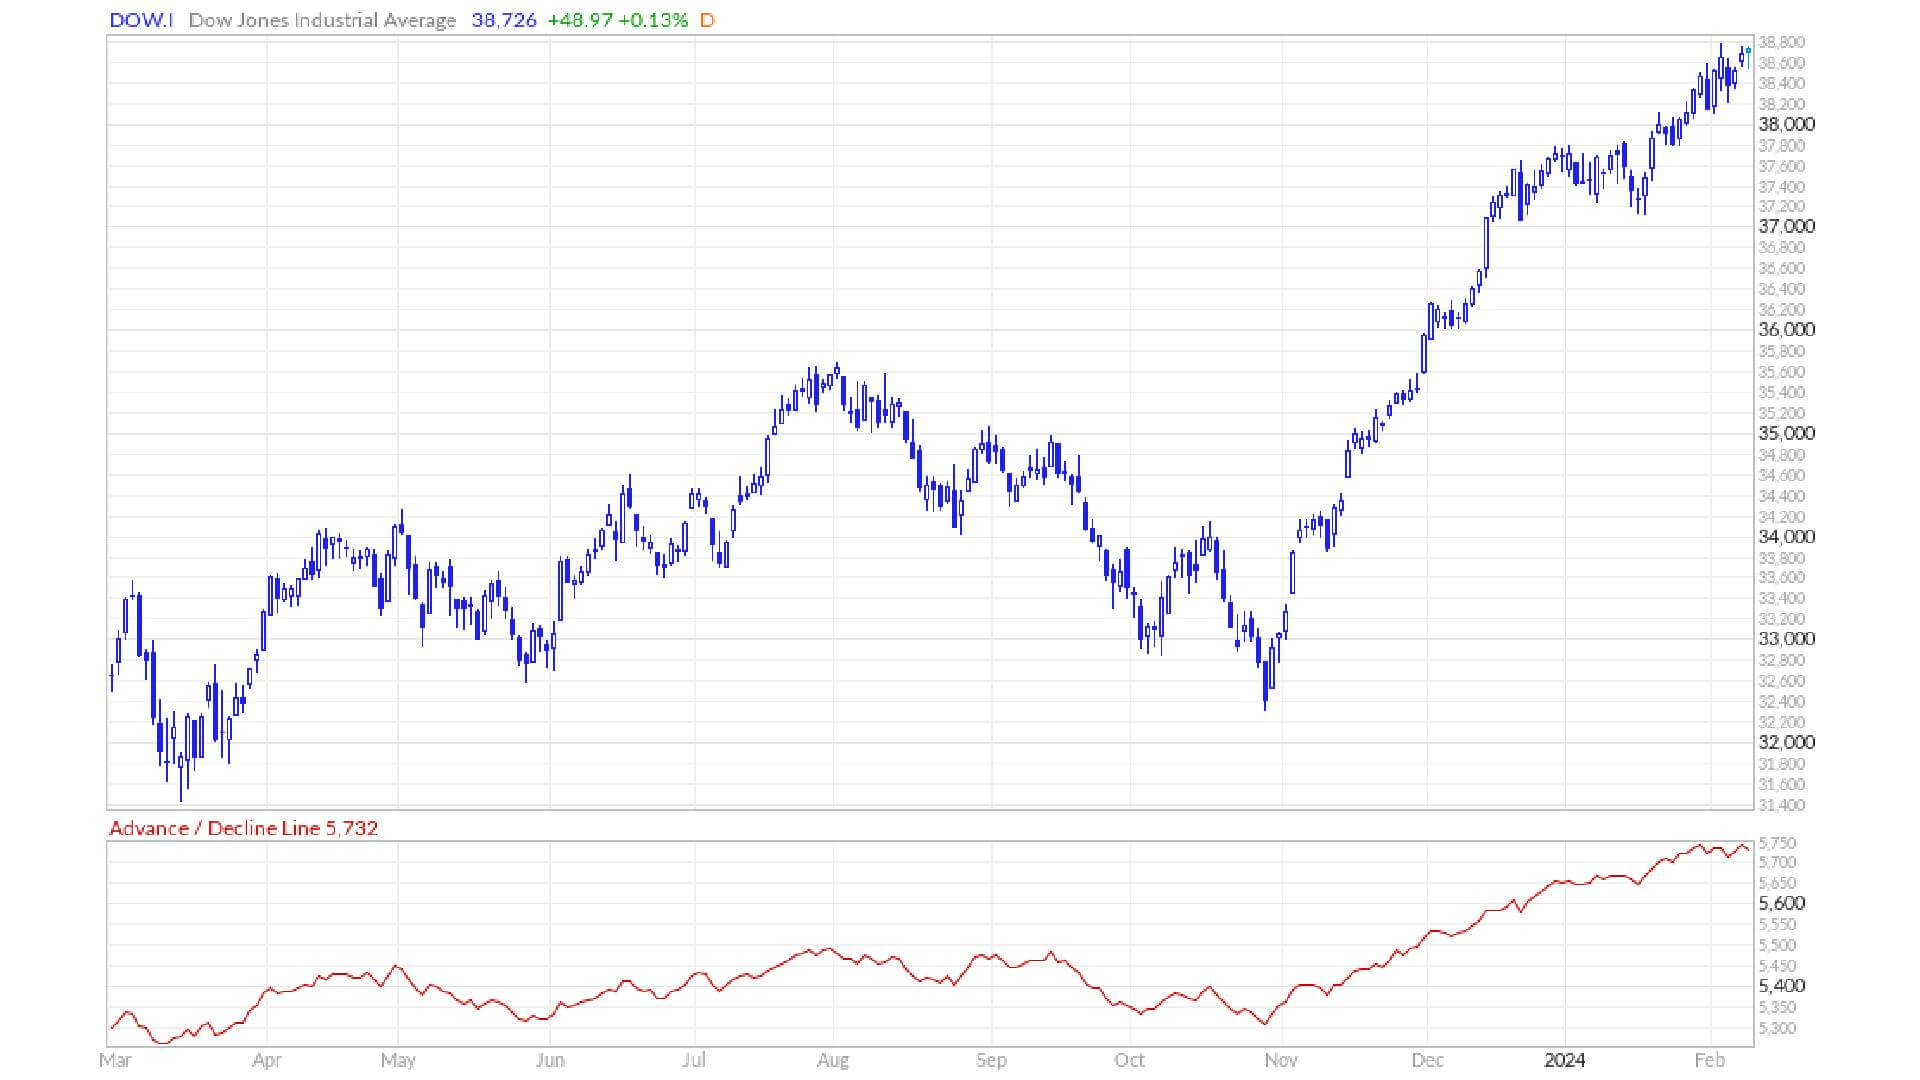
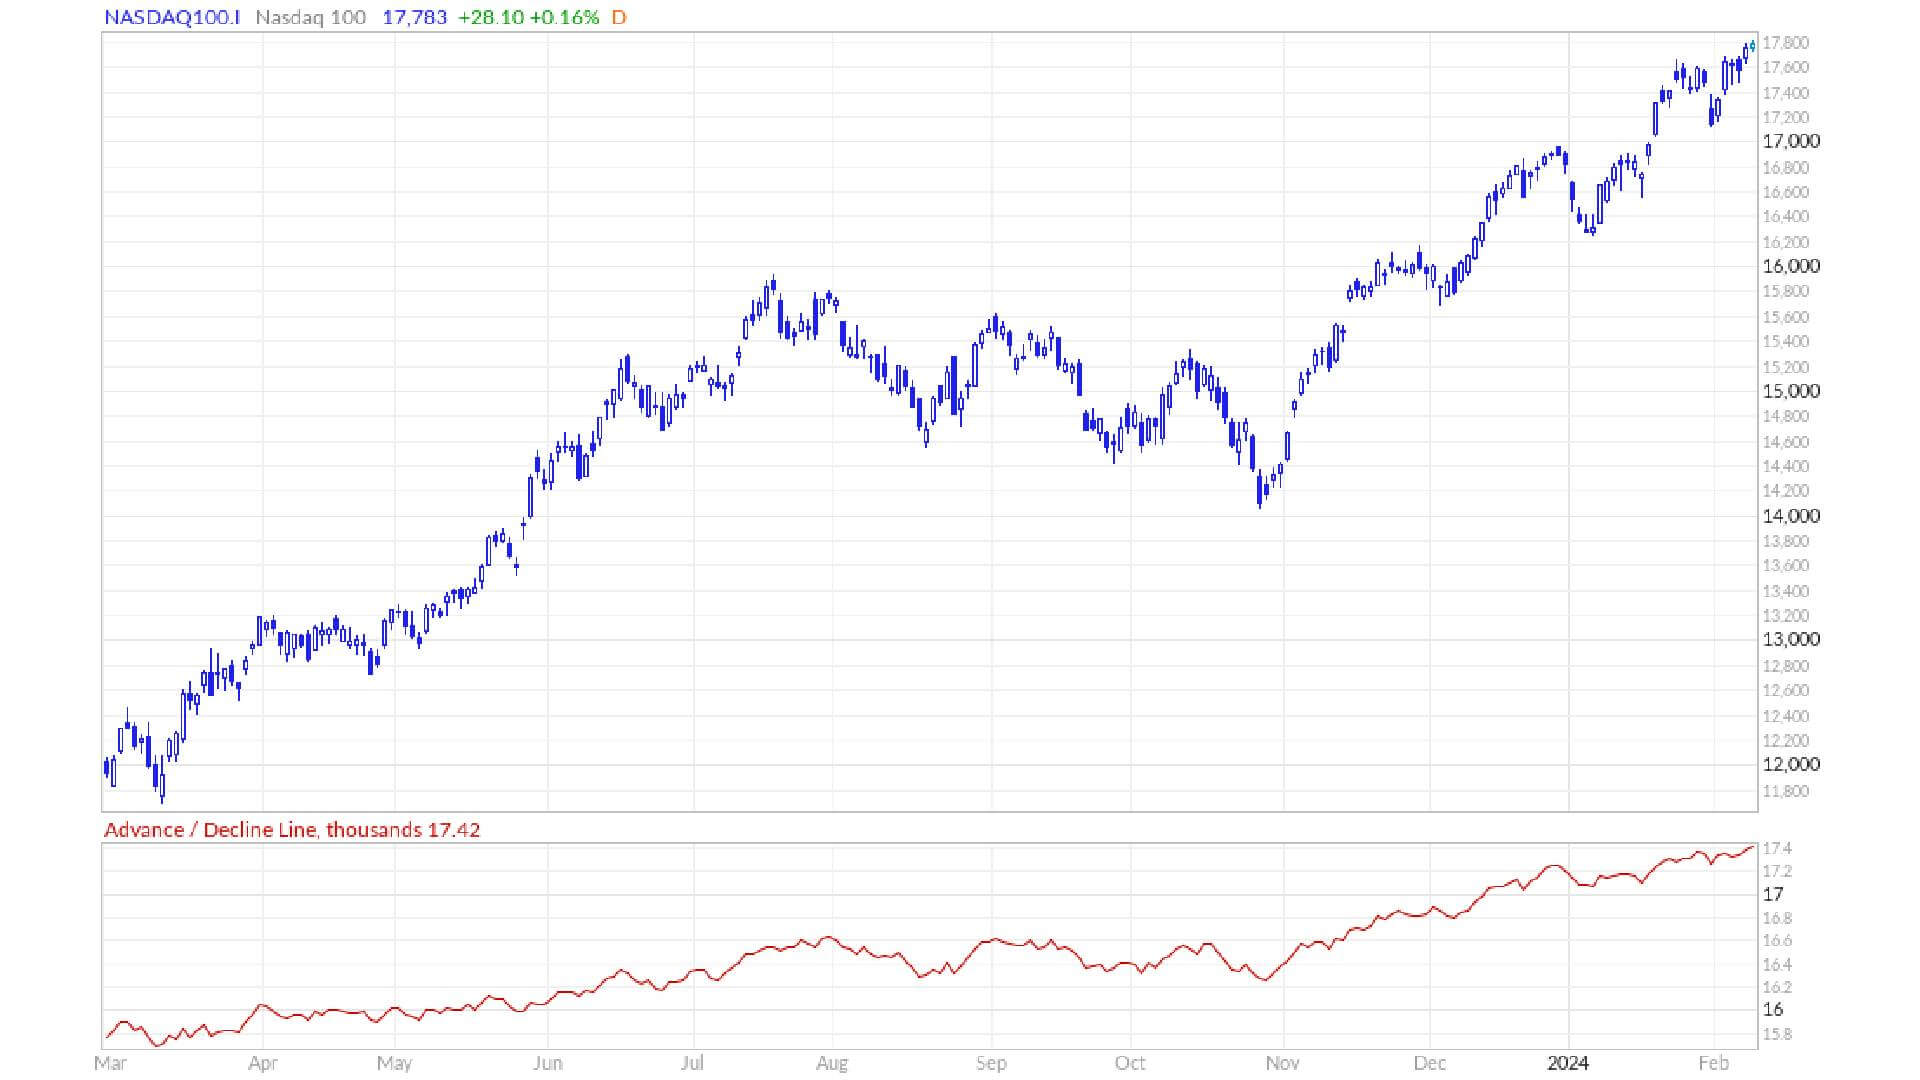
As far as A/D lines are concerned, other than the Nasdaq Composite, all over major indexes seem to be advancing in a healthy manner. As a result, it might be a little premature to start worrying about an impending market decline based on the Nasdaq Composite’s advance/decline line. Market participants can continue to monitor these lines here.


Leave a Comment
You must be logged in to post a comment.